Tube furnace rework
The figures from the writeup, one per screen, in order.
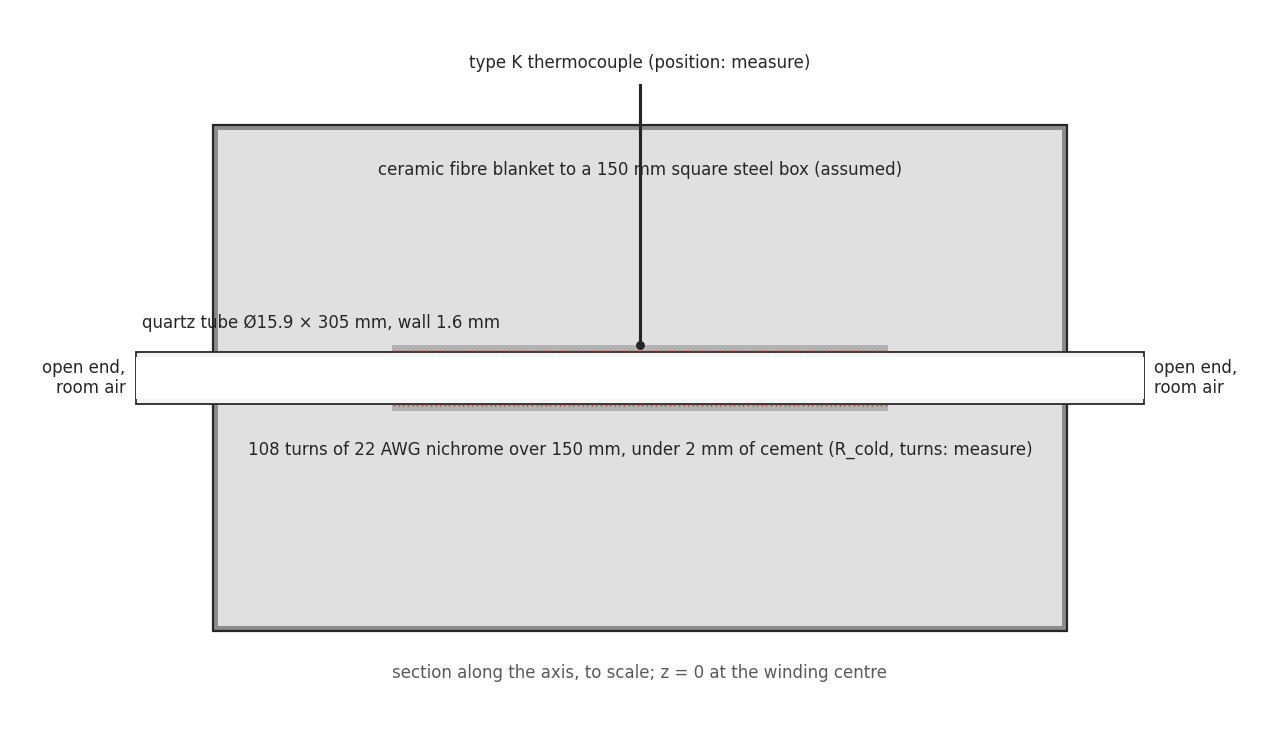
Figure 1. The build as the model sees it, to scale. The dimensions marked “measure” are placeholders until a tape measure and a multimeter replace them.
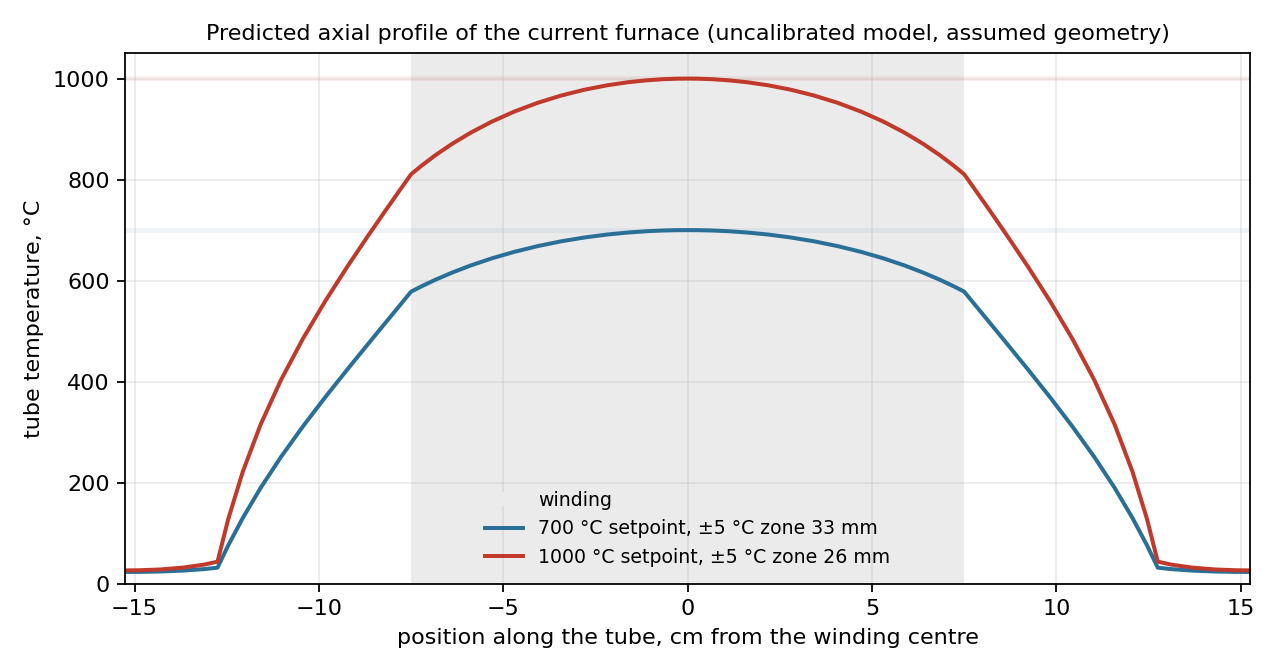
Figure 2. The predicted profile at two setpoints. The grey band is the winding. At 1000 °C the winding ends sit 200 to 300 K below the centre, depending on where the open-bore radiation is taken to leave.
Video 1. The run the table describes, as the model sees it. Top, the profile along the tube with the pieces coloured by their oxide. Bottom, the centre temperature against the setpoint, the relay power, and the oxide at the centre and ±2 and ±4 cm. The pieces go in at the start of the hold; the 25 nm they show at once is the thin-oxide offset the Deal-Grove model applies, which is the part of the model the oxide runs will test first.
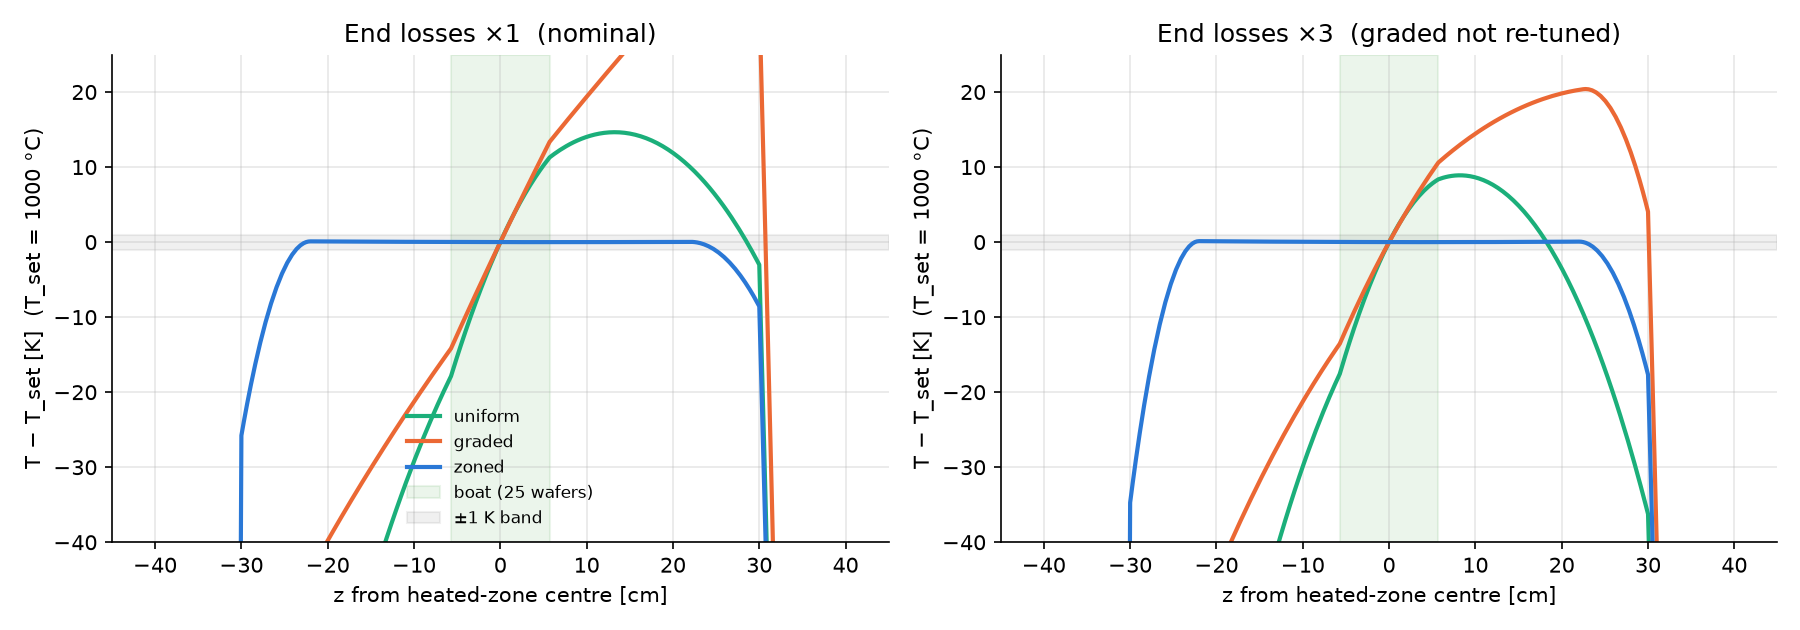
Figure 3. The v2 geometry at 1000 °C with 2 slm of gas. Left, nominal end losses. Right, end losses tripled. Only independent zones stay within ±1 K across the boat.